Nishi Family › Compare › Supervision and Service Monitoring
Nishi Compare · capabilities, evidence and delivery
Supervision and Service Monitoring
Compare capabilities and delivery evidence. Source discovery, qualification, deployment and accepted outcomes are separate; an open contract names work still to verify.
Nishi vs systemd and supervisord and Prometheus and Netdata
Overview
The purpose, declared position and evidence coverage of this domain. Source presence and completed acceptance are different measures.
Where we are. Measured 2026-08-19. Supervision and never-brick promotion are one live circuit with guards, health-gated deploy and rollback, liveness audit and capability-pinned remote ops. Observability depth is the gap the matrix names, and since it was scored (2026-07-10) the estate has shipped pieces the rungs compose rather than invent: nx_netobs (series, probes, a page), nx_resmon (per-process RSS and swap with a trend reader over resmon.log), nx_resgov (memory caps enforced every minute), nx_slo (an importable SLO library), nx_notice and the vizsla notifier. None is yet wired into the supervision surface, which is why the rows stay absent.
Where we need to go. See the fleet on one served surface, act on it (alerts, SLOs, logs), then add the init-system depth systemd is judged on and the anomaly and federation axes Netdata and Prometheus own -- composing the observability organs that already exist.
Latest recorded release
2026-09-02 · R11
nx_hostctl NAS-built on the first headroom of the day (252122 B sha 08b071a9, BQ row fired rc=0), staged by verified copy from buildroot/_build and DEPLOYED through the selfswap row with the audited evidence-honesty override: DEPLOYED-GREEN listen=VERIFIED; the supervisor now carries rg_bind_grace_expired in hc_guard_admin and hc_build_debug_armed in cmd_buildrun; the live HUNG-AT-START witness (a planted never-binding admin daemon restarted inside the grace bound) is the remaining done-rule conjunct
Release entries describe recorded changes; they do not establish that every capability passed evaluation.
9 of 25 capability source symbols found|2 of them authored stronger-claims|16 open|coverage 360/1000|adoption 7 full / 2 partial
Evidence profile — what the gaps on this board actually are
Measured by nx_swcompare_evidence, read back by nx_evprofile_lib. Every figure is a count with its denominator — there is deliberately no score, no grade and no percentage anywhere in this band, because a stored scalar is a field a seat can edit and a counted partition is not.
evidence|grounded 9/9|unsupported 0|gates green 1/1|proven able to fail 1/1|never bitten 0|green at 0/0 0|open gaps 16|of them unnamed 0|of them proof withheld 0|flips ready 0
proven able to fail counts the gates that have a RECORDED RED — nx_gate_bite mutated the gate subject, rebuilt it, watched the gate go red, and that record is inside the shared TTL. never bitten is its complement over the same denominator: those gates ran and were green, and nothing has ever shown them able to detect anything, so their green is a statement about this run and not about the gate. green at 0/0 is a separate and much weaker observation — the gate printed GREEN on a zero denominator, so its own tooth counter says it examined nothing. A gate can be green, non-zero, and still never bitten; that is the common case and it is now visible instead of implied.
partition: grounded + unsupported = 9 vs present 9 · named + unnamed + withheld = 16 vs open 16 · both reconcile
liar-kill conj=GPQN · all four conjuncts held
graded document: BUILDROOT tree, 8928 bytes · gates map: PRIMARY · stamped 2d 19h ago · source ../knowledge/status/evstamp_supervisor.verdict
| Gap class | What it is, and the work it names |
|---|---|
| NONE | No gap class fires on this board: every published claim is grounded, the declared gates ran and were green, no watch contract is unnamed or already landed, and the stamp is inside its TTL. That is a statement about evidence, not about depth, scale or polish. |
nx_swcompare_evidence supervisor itself and are not carried on the stamp, so this page names the classes and the producer names the rows. That split is stated rather than hidden: a count without a worklist is not actionable, and this band is honest about which half of that it is.Production map
Follow the dependencies, declared acceptance criteria and recorded priorities. Inspect source binding before treating a rank as executable work.
Ranking source binding: PLAN_MATRIX_BOUND_ONLY. Recorded priorities require current acceptance evidence and resource checks before execution.
Ranking matches the captured plan and matrix only. Latest execution outcome, research freshness, accepted delivery and investment return are unverified.
Recorded priority estimates
Order from nx_compare_rank (nx_dr_ocm: (deficit + cost-of-delay + option + enables) x sponsor x self-sufficiency x momentum / cost). FINISH rows are rungs whose symbol is present but whose organ is short of full adoption: listed before new work by this heuristic. Priority is not measured delivery cost or execution readiness. Stamp: # asof=1790081752 domain=supervisor target_version=0.1 rungs=12 done=1 open=11 finish=0 ranker=nx_dr_ocm
| # | Stage | Rung | Priority | Derivation |
|---|---|---|---|---|
| #1 | 0.1 | Per-service resource metrics (R1) rmx_sample dossier | 2000 | v=20 m=1 c=10 |
| #2 | 0.1 | Metrics history (R2) ts_append dossier | 1000 | v=15 m=1 c=15 |
| #3 | 0.1 | Health UI (R0) hu_page dossier | 133 | v=2 m=1 c=15 |
| #4 | later | Dependency-ordered startup (R6) hc_dep_order dossier | 1000 | v=15 m=1 c=15 |
| #5 | later | Alert routing (R3) nl_route_alert dossier | 300 | v=3 m=1 c=10 |
| #6 | later | Resource-limit enforcement named (R7) rg_enforce dossier | 200 | v=2 m=1 c=10 |
| #7 | later | Log aggregation (R5) la_tail_index dossier | 133 | v=2 m=1 c=15 |
| #8 | later | Socket and timer activation (R8) sa_listen dossier | 100 | v=2 m=1 c=20 |
| #9 | later | Anomaly detection (R9) ao_detect dossier | 100 | v=2 m=1 c=20 |
| #10 | later | Federated monitoring (R10) fm_federate dossier | 100 | v=2 m=1 c=20 |
| #11 | later | SLO report (R4) hc_slo_report dossier | 0 | v=0 m=1 c=5 |
Declared roadmap — contract, acceptance, executor, effort
| Rung | Closes with | Definition of done (pre-declared) | Executor | Est. |
|---|---|---|---|---|
| Health UI (R0) | hu_page | A served monitoring page composing what already exists -- mgmt_snap.json, nx_netobs no_page and no_svg_series, resmon.log -- with what-to-look-at-first ordering; graded by the UI judge against the Netdata bar; closes the dashboard row and U1 to U4 which share this symbol | Organ | 1.5 u |
| Per-service resource metrics (R1) | rmx_sample | CPU, memory and IO per supervised service sampled on the beat (nx_resmon already meters RSS and swap per process; CPU and IO join it) and written as rows; the partition of services sums | Organ | 1 u |
| Metrics history (R2) after R1 | ts_append | An append-only time-series store over the per-service samples with a bounded reader; nx_sizeguard budgets it; resmon.log and netobs series are the first two writers | Organ | 1.5 u |
| Alert routing (R3) | nl_route_alert | A health RED or budget breach routes through the notice ledger to the vizsla reminder engine and email digest already proven for deadlines; a planted RED reaches the digest and a GREEN does not | Organ | 1 u |
| SLO report (R4) after R2 | hc_slo_report | nx_slo (availability permille, error budget, latency percentile) computed per service from the history and printed by hostctl status; a breach is a verdict, not a log line | Organ | 0.5 u |
| Log aggregation (R5) | la_tail_index | The per-daemon /tmp tails indexed into one searchable store on the beat; a query returns the line and its daemon and epoch | Organ | 1.5 u |
| Dependency-ordered startup (R6) | hc_dep_order | Services declare dependencies as data and hostctl starts them in topological order with a loud cycle refusal; a planted cycle is refused | Organ | 1.5 u |
| Resource-limit enforcement named (R7) after R1 | rg_enforce | The resgov memory caps already live are extracted into a named enforcement function and extended to CPU and IO limits as conf rows; a process over its declared limit is governed and the action is logged | Organ | 1 u |
| Socket and timer activation (R8) after R6 | sa_listen | A daemon may declare socket activation so hostctl holds the listener and spawns on first connection; measured idle cost drops to zero for the declared services | Organ | 2 u |
| Anomaly detection (R9) after R2 | ao_detect | Per-series anomaly flags from the history (rate-of-change and seasonal baselines) that ABSTAIN with too little history; a planted spike is flagged and a flat series is not | Organ | 2 u |
| Federated monitoring (R10) after R2 | fm_federate | Laptop, NAS and workers report into one history with per-host partition; the UI shows the fleet, not one box | Organ | 2 u |
| Alive-but-never-listening bind grace (R11) | rg_bind_grace_expired | ADDED 2026-09-02 FROM A 16-HOUR OUTAGE. hc_guard_admin tested only the process NAME, so a respawn that spun 15.9h inside its shard pre-warm with :18456 never opened read UP on every surface (the guard and the mgmt snapshot share proc_alive_by_name) while /search answered 503. The guard now composes hp_socket_dead (connect-only, two refusals apart) with a PURE grace predicate in nx_restart_guard: a daemon whose port stays dead past HC_ADMIN_BIND_GRACE_POLLS (40 x the 15s supervise cadence, derived from the measured worst legitimate start of 6 min lock wait plus 13s warm) is killed and respawned under the crash-loop guard, every waiting poll announced. Refereed by nx_restart_guard_gate T6-T10 (inside-grace waits, exhausted restarts, listening or dead-by-PID or unset grace never restart), GREEN on the laptop lane. DONE-RULE: the promoted supervisor carries the predicate call in hc_guard_admin AND a planted never-binding admin daemon is restarted inside the grace bound on the live box, logged HUNG-AT-START. Generalising the same grace to every port-bearing guard in this file is the follow-on, not this rung | Organ | 0.5 u |
Milestones
| Milestone | Rungs | Cumulative |
|---|---|---|
| M0 · See the fleet | R0,R1,R2,R11 | 4.5 u |
| M1 · Act on it | R3,R4,R5 | 7 u |
| M2 · Init-system depth | R6,R7,R8 | 11.5 u |
| M3 · Beyond | R9,R10 | 15.5 u |
| Class | Count | Note |
|---|---|---|
| bars | 0 | sotabar rows on the plan |
| fresh | 0 | the bar month is the current month |
| attested | 0 | an older bar with a this-month barscan reporting no newer entry |
| stale | 0 | a this-month scan saw a newer month the bar ignores |
| unattested | 0 | nobody looked this month |
| malformed | 0 | a sotabar row missing a field |
| duplicate | 0 | bar ids an earlier row already carries |
| bars, summed | 0 | RECONCILED: the parts sum to the total 0 |
| current month | 2026-10 | the month every bar is judged against |
Inspect a rung and its prerequisites
Declared nodes 12. Rank input binding: PLAN_MATRIX_BOUND_ONLY. Dependency order is authored. Implementation, acceptance evidence, authority and resource readiness are unverified. No action is recommended or dispatched here.
Plan SHA-256 045ccd0b1d1c2d9c070571e34c4efa99e4008c9db67ca1de8b62a99fd1954d7e. Target rows 0; role rows 0. Existing risks and release worklog retain their own scope; no node completion is inferred.
Runtime observation coverage: 0 of 12 rungs have current, identity-bound execution observations. Observation may report RED. Accepted completion remains unknown; source presence, qualification and deployment do not establish it.
Use Enter or Space on a rung to inspect its contract. Prerequisite links locate another rung in this list; open its summary to inspect it. Estimates are authored effort, not forecasts.
R0 — Health UI
Prerequisites: None declared; this does not establish execution eligibility.
Contract:
hu_pageAcceptance: A served monitoring page composing what already exists -- mgmt_snap.json, nx_netobs no_page and no_svg_series, resmon.log -- with what-to-look-at-first ordering; graded by the UI judge against the Netdata bar; closes the dashboard row and U1 to U4 which share this symbol
Authored effort: 1.5. Executor kind: Organ. Responsible, accountable and verifier not established. Inspect retained worklog.
Runtime observation: UNKNOWN; outcome UNKNOWN; observed epoch -1. Declared owner: . Receipt
, SHA-256. Identity-bound observation is not accepted completion. Qualification and deployment remain unverified by this projection.R1 — Per-service resource metrics
Prerequisites: None declared; this does not establish execution eligibility.
Contract:
rmx_sampleAcceptance: CPU, memory and IO per supervised service sampled on the beat (nx_resmon already meters RSS and swap per process; CPU and IO join it) and written as rows; the partition of services sums
Authored effort: 1. Executor kind: Organ. Responsible, accountable and verifier not established. Inspect retained worklog.
Runtime observation: UNKNOWN; outcome UNKNOWN; observed epoch -1. Declared owner: . Receipt
, SHA-256. Identity-bound observation is not accepted completion. Qualification and deployment remain unverified by this projection.R2 — Metrics history
Prerequisites: R1 (acceptance unverified)
Contract:
ts_appendAcceptance: An append-only time-series store over the per-service samples with a bounded reader; nx_sizeguard budgets it; resmon.log and netobs series are the first two writers
Authored effort: 1.5. Executor kind: Organ. Responsible, accountable and verifier not established. Inspect retained worklog.
Runtime observation: UNKNOWN; outcome UNKNOWN; observed epoch -1. Declared owner: . Receipt
, SHA-256. Identity-bound observation is not accepted completion. Qualification and deployment remain unverified by this projection.R3 — Alert routing
Prerequisites: None declared; this does not establish execution eligibility.
Contract:
nl_route_alertAcceptance: A health RED or budget breach routes through the notice ledger to the vizsla reminder engine and email digest already proven for deadlines; a planted RED reaches the digest and a GREEN does not
Authored effort: 1. Executor kind: Organ. Responsible, accountable and verifier not established. Inspect retained worklog.
Runtime observation: UNKNOWN; outcome UNKNOWN; observed epoch -1. Declared owner: . Receipt
, SHA-256. Identity-bound observation is not accepted completion. Qualification and deployment remain unverified by this projection.R4 — SLO report
Prerequisites: R2 (acceptance unverified)
Contract:
hc_slo_reportAcceptance: nx_slo (availability permille, error budget, latency percentile) computed per service from the history and printed by hostctl status; a breach is a verdict, not a log line
Authored effort: 0.5. Executor kind: Organ. Responsible, accountable and verifier not established. Inspect retained worklog.
Runtime observation: UNKNOWN; outcome UNKNOWN; observed epoch -1. Declared owner: . Receipt
, SHA-256. Identity-bound observation is not accepted completion. Qualification and deployment remain unverified by this projection.R5 — Log aggregation
Prerequisites: None declared; this does not establish execution eligibility.
Contract:
la_tail_indexAcceptance: The per-daemon /tmp tails indexed into one searchable store on the beat; a query returns the line and its daemon and epoch
Authored effort: 1.5. Executor kind: Organ. Responsible, accountable and verifier not established. Inspect retained worklog.
Runtime observation: UNKNOWN; outcome UNKNOWN; observed epoch -1. Declared owner: . Receipt
, SHA-256. Identity-bound observation is not accepted completion. Qualification and deployment remain unverified by this projection.R6 — Dependency-ordered startup
Prerequisites: None declared; this does not establish execution eligibility.
Contract:
hc_dep_orderAcceptance: Services declare dependencies as data and hostctl starts them in topological order with a loud cycle refusal; a planted cycle is refused
Authored effort: 1.5. Executor kind: Organ. Responsible, accountable and verifier not established. Inspect retained worklog.
Runtime observation: UNKNOWN; outcome UNKNOWN; observed epoch -1. Declared owner: . Receipt
, SHA-256. Identity-bound observation is not accepted completion. Qualification and deployment remain unverified by this projection.R7 — Resource-limit enforcement named
Prerequisites: R1 (acceptance unverified)
Contract:
rg_enforceAcceptance: The resgov memory caps already live are extracted into a named enforcement function and extended to CPU and IO limits as conf rows; a process over its declared limit is governed and the action is logged
Authored effort: 1. Executor kind: Organ. Responsible, accountable and verifier not established. Inspect retained worklog.
Runtime observation: UNKNOWN; outcome UNKNOWN; observed epoch -1. Declared owner: . Receipt
, SHA-256. Identity-bound observation is not accepted completion. Qualification and deployment remain unverified by this projection.R8 — Socket and timer activation
Prerequisites: R6 (acceptance unverified)
Contract:
sa_listenAcceptance: A daemon may declare socket activation so hostctl holds the listener and spawns on first connection; measured idle cost drops to zero for the declared services
Authored effort: 2. Executor kind: Organ. Responsible, accountable and verifier not established. Inspect retained worklog.
Runtime observation: UNKNOWN; outcome UNKNOWN; observed epoch -1. Declared owner: . Receipt
, SHA-256. Identity-bound observation is not accepted completion. Qualification and deployment remain unverified by this projection.R9 — Anomaly detection
Prerequisites: R2 (acceptance unverified)
Contract:
ao_detectAcceptance: Per-series anomaly flags from the history (rate-of-change and seasonal baselines) that ABSTAIN with too little history; a planted spike is flagged and a flat series is not
Authored effort: 2. Executor kind: Organ. Responsible, accountable and verifier not established. Inspect retained worklog.
Runtime observation: UNKNOWN; outcome UNKNOWN; observed epoch -1. Declared owner: . Receipt
, SHA-256. Identity-bound observation is not accepted completion. Qualification and deployment remain unverified by this projection.R10 — Federated monitoring
Prerequisites: R2 (acceptance unverified)
Contract:
fm_federateAcceptance: Laptop, NAS and workers report into one history with per-host partition; the UI shows the fleet, not one box
Authored effort: 2. Executor kind: Organ. Responsible, accountable and verifier not established. Inspect retained worklog.
Runtime observation: UNKNOWN; outcome UNKNOWN; observed epoch -1. Declared owner: . Receipt
, SHA-256. Identity-bound observation is not accepted completion. Qualification and deployment remain unverified by this projection.R11 — Alive-but-never-listening bind grace
Prerequisites: None declared; this does not establish execution eligibility.
Contract:
rg_bind_grace_expiredAcceptance: ADDED 2026-09-02 FROM A 16-HOUR OUTAGE. hc_guard_admin tested only the process NAME, so a respawn that spun 15.9h inside its shard pre-warm with :18456 never opened read UP on every surface (the guard and the mgmt snapshot share proc_alive_by_name) while /search answered 503. The guard now composes hp_socket_dead (connect-only, two refusals apart) with a PURE grace predicate in nx_restart_guard: a daemon whose port stays dead past HC_ADMIN_BIND_GRACE_POLLS (40 x the 15s supervise cadence, derived from the measured worst legitimate start of 6 min lock wait plus 13s warm) is killed and respawned under the crash-loop guard, every waiting poll announced. Refereed by nx_restart_guard_gate T6-T10 (inside-grace waits, exhausted restarts, listening or dead-by-PID or unset grace never restart), GREEN on the laptop lane. DONE-RULE: the promoted supervisor carries the predicate call in hc_guard_admin AND a planted never-binding admin daemon is restarted inside the grace bound on the live box, logged HUNG-AT-START. Generalising the same grace to every port-bearing guard in this file is the follow-on, not this rung
Authored effort: 0.5. Executor kind: Organ. Responsible, accountable and verifier not established. Inspect retained worklog.
Runtime observation: UNKNOWN; outcome UNKNOWN; observed epoch -1. Declared owner: . Receipt
, SHA-256. Identity-bound observation is not accepted completion. Qualification and deployment remain unverified by this projection.
Learning and practice paths
No structured learning path is declared for this plan. Existing research, roadmap and worklog remain available above.
Rung dossiers — every record that bears on a rung, in one place
nx_swcompare_evidence supervisor writes it beside its stamp); every gate below reads UNRECORDED until it runs.knowledge/organ_gate.conf read from this working directory (1 rows) and from the estate root (196 rows); rows in both counted once: 0; declarations read: 197. Every declaration in either copy counts, so a stub beside the publisher can never hide the root.R0 Health UI · cell WATCHING · gate NO-GATE-DECLARED
| Contract | hu_page · executor Organ · 1.5 u · stands on nothing |
|---|---|
| Definition of done | A served monitoring page composing what already exists -- mgmt_snap.json, nx_netobs no_page and no_svg_series, resmon.log -- with what-to-look-at-first ordering; graded by the UI judge against the Netdata bar; closes the dashboard row and U1 to U4 which share this symbol |
| Matrix cell | Web health dashboard · runtime/nx_health_ui.nx · WATCHING declU1 visual design of the monitoring surface · runtime/nx_health_ui.nx · WATCHING declU2 interaction quality (drill-down, filtering, latency) · runtime/nx_health_ui.nx · WATCHING declU3 information design (what to look at first) · runtime/nx_health_ui.nx · WATCHING declU4 polish and cohesion · runtime/nx_health_ui.nx · WATCHING decl |
| Gate | NO-GATE-DECLARED — knowledge/organ_gate.conf carries no row for nx_health_ui; declare nx_health_ui TAB <gate> and the ship loop proves it and the verdict lands here. |
| Work log | no log row names this rung yet |
R1 Per-service resource metrics · cell WATCHING · gate NO-GATE-DECLARED
| Contract | rmx_sample · executor Organ · 1 u · stands on nothing |
|---|---|
| Definition of done | CPU, memory and IO per supervised service sampled on the beat (nx_resmon already meters RSS and swap per process; CPU and IO join it) and written as rows; the partition of services sums |
| Matrix cell | Per-service resource metrics (CPU mem IO) · runtime/nx_resmetrics.nx · WATCHING decl |
| Gate | NO-GATE-DECLARED — knowledge/organ_gate.conf carries no row for nx_resmetrics; declare nx_resmetrics TAB <gate> and the ship loop proves it and the verdict lands here. |
| Work log | no log row names this rung yet |
R2 Metrics history · cell WATCHING · gate NO-GATE-DECLARED
| Contract | ts_append · executor Organ · 1.5 u · stands on R1 |
|---|---|
| Definition of done | An append-only time-series store over the per-service samples with a bounded reader; nx_sizeguard budgets it; resmon.log and netobs series are the first two writers |
| Matrix cell | Time-series metrics database · runtime/nx_tsdb.nx · WATCHING decl |
| Gate | NO-GATE-DECLARED — knowledge/organ_gate.conf carries no row for nx_tsdb; declare nx_tsdb TAB <gate> and the ship loop proves it and the verdict lands here. |
| Work log | no log row names this rung yet |
R3 Alert routing · cell WATCHING · gate NO-GATE-DECLARED
| Contract | nl_route_alert · executor Organ · 1 u · stands on nothing |
|---|---|
| Definition of done | A health RED or budget breach routes through the notice ledger to the vizsla reminder engine and email digest already proven for deadlines; a planted RED reaches the digest and a GREEN does not |
| Matrix cell | Alerting rules + notification routing · runtime/_hdl_build/nx_notice.nx · WATCHING decl |
| Gate | NO-GATE-DECLARED — knowledge/organ_gate.conf carries no row for nx_notice; declare nx_notice TAB <gate> and the ship loop proves it and the verdict lands here. |
| Work log | no log row names this rung yet |
R4 SLO report · cell WATCHING · gate UNRECORDED
| Contract | hc_slo_report · executor Organ · 0.5 u · stands on R2 |
|---|---|
| Definition of done | nx_slo (availability permille, error budget, latency percentile) computed per service from the history and printed by hostctl status; a breach is a verdict, not a log line |
| Matrix cell | SLO / error-budget tracking · runtime/_hdl_build/nx_hostctl.nx · WATCHING decl |
| Gate | nx_hostctl_keepbackoff_gate · UNRECORDED — no recorded verdict for this gate (it is declared for the organ but the evidence referee's last run did not record it: it is not on this board's gates map, or the referee has not run since the per-gate record shipped)nx_hostctl_buildrun_gate · UNRECORDED — no recorded verdict for this gate (it is declared for the organ but the evidence referee's last run did not record it: it is not on this board's gates map, or the referee has not run since the per-gate record shipped)nx_exactkill_gate · UNRECORDED — no recorded verdict for this gate (it is declared for the organ but the evidence referee's last run did not record it: it is not on this board's gates map, or the referee has not run since the per-gate record shipped) |
| Work log | no log row names this rung yet |
R5 Log aggregation · cell WATCHING · gate NO-GATE-DECLARED
| Contract | la_tail_index · executor Organ · 1.5 u · stands on nothing |
|---|---|
| Definition of done | The per-daemon /tmp tails indexed into one searchable store on the beat; a query returns the line and its daemon and epoch |
| Matrix cell | Log aggregation + search · runtime/nx_log_aggregate.nx · WATCHING decl |
| Gate | NO-GATE-DECLARED — knowledge/organ_gate.conf carries no row for nx_log_aggregate; declare nx_log_aggregate TAB <gate> and the ship loop proves it and the verdict lands here. |
| Work log | no log row names this rung yet |
R6 Dependency-ordered startup · cell WATCHING · gate UNRECORDED
| Contract | hc_dep_order · executor Organ · 1.5 u · stands on nothing |
|---|---|
| Definition of done | Services declare dependencies as data and hostctl starts them in topological order with a loud cycle refusal; a planted cycle is refused |
| Matrix cell | Dependency-ordered startup graph · runtime/_hdl_build/nx_hostctl.nx · WATCHING decl |
| Gate | nx_hostctl_keepbackoff_gate · UNRECORDED — no recorded verdict for this gate (it is declared for the organ but the evidence referee's last run did not record it: it is not on this board's gates map, or the referee has not run since the per-gate record shipped)nx_hostctl_buildrun_gate · UNRECORDED — no recorded verdict for this gate (it is declared for the organ but the evidence referee's last run did not record it: it is not on this board's gates map, or the referee has not run since the per-gate record shipped)nx_exactkill_gate · UNRECORDED — no recorded verdict for this gate (it is declared for the organ but the evidence referee's last run did not record it: it is not on this board's gates map, or the referee has not run since the per-gate record shipped) |
| Work log | no log row names this rung yet |
R7 Resource-limit enforcement named · cell WATCHING · gate NO-GATE-DECLARED
| Contract | rg_enforce · executor Organ · 1 u · stands on R1 |
|---|---|
| Definition of done | The resgov memory caps already live are extracted into a named enforcement function and extended to CPU and IO limits as conf rows; a process over its declared limit is governed and the action is logged |
| Matrix cell | Resource-limit enforcement · runtime/nx_resgov.nx · WATCHING decl |
| Gate | NO-GATE-DECLARED — knowledge/organ_gate.conf carries no row for nx_resgov; declare nx_resgov TAB <gate> and the ship loop proves it and the verdict lands here. |
| Work log | no log row names this rung yet |
R8 Socket and timer activation · cell WATCHING · gate NO-GATE-DECLARED
| Contract | sa_listen · executor Organ · 2 u · stands on R6 |
|---|---|
| Definition of done | A daemon may declare socket activation so hostctl holds the listener and spawns on first connection; measured idle cost drops to zero for the declared services |
| Matrix cell | Socket / timer activation · runtime/nx_socket_activate.nx · WATCHING decl |
| Gate | NO-GATE-DECLARED — knowledge/organ_gate.conf carries no row for nx_socket_activate; declare nx_socket_activate TAB <gate> and the ship loop proves it and the verdict lands here. |
| Work log | no log row names this rung yet |
R9 Anomaly detection · cell WATCHING · gate NO-GATE-DECLARED
| Contract | ao_detect · executor Organ · 2 u · stands on R2 |
|---|---|
| Definition of done | Per-series anomaly flags from the history (rate-of-change and seasonal baselines) that ABSTAIN with too little history; a planted spike is flagged and a flat series is not |
| Matrix cell | Anomaly detection / AIOps · runtime/nx_aiops.nx · WATCHING decl |
| Gate | NO-GATE-DECLARED — knowledge/organ_gate.conf carries no row for nx_aiops; declare nx_aiops TAB <gate> and the ship loop proves it and the verdict lands here. |
| Work log | no log row names this rung yet |
R10 Federated monitoring · cell WATCHING · gate NO-GATE-DECLARED
| Contract | fm_federate · executor Organ · 2 u · stands on R2 |
|---|---|
| Definition of done | Laptop, NAS and workers report into one history with per-host partition; the UI shows the fleet, not one box |
| Matrix cell | Multi-host federated monitoring · runtime/nx_fed_monitor.nx · WATCHING decl |
| Gate | NO-GATE-DECLARED — knowledge/organ_gate.conf carries no row for nx_fed_monitor; declare nx_fed_monitor TAB <gate> and the ship loop proves it and the verdict lands here. |
| Work log | no log row names this rung yet |
R11 Alive-but-never-listening bind grace · cell PRESENT · gate UNRECORDED
| Contract | rg_bind_grace_expired · executor Organ · 0.5 u · stands on nothing |
|---|---|
| Definition of done | ADDED 2026-09-02 FROM A 16-HOUR OUTAGE. hc_guard_admin tested only the process NAME, so a respawn that spun 15.9h inside its shard pre-warm with :18456 never opened read UP on every surface (the guard and the mgmt snapshot share proc_alive_by_name) while /search answered 503. The guard now composes hp_socket_dead (connect-only, two refusals apart) with a PURE grace predicate in nx_restart_guard: a daemon whose port stays dead past HC_ADMIN_BIND_GRACE_POLLS (40 x the 15s supervise cadence, derived from the measured worst legitimate start of 6 min lock wait plus 13s warm) is killed and respawned under the crash-loop guard, every waiting poll announced. Refereed by nx_restart_guard_gate T6-T10 (inside-grace waits, exhausted restarts, listening or dead-by-PID or unset grace never restart), GREEN on the laptop lane. DONE-RULE: the promoted supervisor carries the predicate call in hc_guard_admin AND a planted never-binding admin daemon is restarted inside the grace bound on the live box, logged HUNG-AT-START. Generalising the same grace to every port-bearing guard in this file is the follow-on, not this rung |
| Matrix cell | Alive-but-never-listening bind grace (a live PID that never binds is restarted) · runtime/nx_restart_guard.nx · PRESENT decl |
| Gate | nx_restart_guard_gate · UNRECORDED — no recorded verdict for this gate (it is declared for the organ but the evidence referee's last run did not record it: it is not on this board's gates map, or the referee has not run since the per-gate record shipped) |
| Work log | 2026-09-02 land rg_bind_grace_expired(alive, socket_dead, dead_polls, grace_polls) landed in nx_restart_guard.nx (6123 B) with nx_restart_guard_gate T6-T10 (5113 B) GREEN on the laptop lane; nx_hostctl hc_guard_admin now composes hp_socket_dead(HC_MAGIC_18456) with the predicate under HC_ADMIN_BIND_GRACE_POLLS=40 and proc_kill_by_name plus hc_spawn_admin under the crash-loop guard, every waiting poll announced; hostctl compile-proven locally (250848 B); NAS build queued as BQ-nx_hostctl under admission (procs_running 14 of 8, procs_blocked 7); deploy owed through /api/deploy target=hostctl (selfswap, superrollback) and the live HUNG-AT-START witness is the remaining done-rule conjunct 2026-09-02 lesson the same guard predicate that fed the supervisor fed the mgmt snapshot, so a daemon that never opened its port read UP everywhere; a liveness check must include the thing the daemon exists to do (accept a connection), and the grace it needs is derived from the measured worst legitimate start, never picked 2026-09-02 land nx_hostctl NAS-built on the first headroom of the day (252122 B sha 08b071a9, BQ row fired rc=0), staged by verified copy from buildroot/_build and DEPLOYED through the selfswap row with the audited evidence-honesty override: DEPLOYED-GREEN listen=VERIFIED; the supervisor now carries rg_bind_grace_expired in hc_guard_admin and hc_build_debug_armed in cmd_buildrun; the live HUNG-AT-START witness (a planted never-binding admin daemon restarted inside the grace bound) is the remaining done-rule conjunct |
dossiers=12 cells_joined=12 no_matrix_row=0 (sum 12) gates_recorded=0 gates_unrecorded=3 no_gate_declared=9 (sum 12 of cells_joined) evgates=UNSTAMPED
Capability comparisons
Compare the field, search individual capabilities and open their source and adoption evidence. Documented presence does not establish comparative quality.
Position map — centrality and distinctiveness
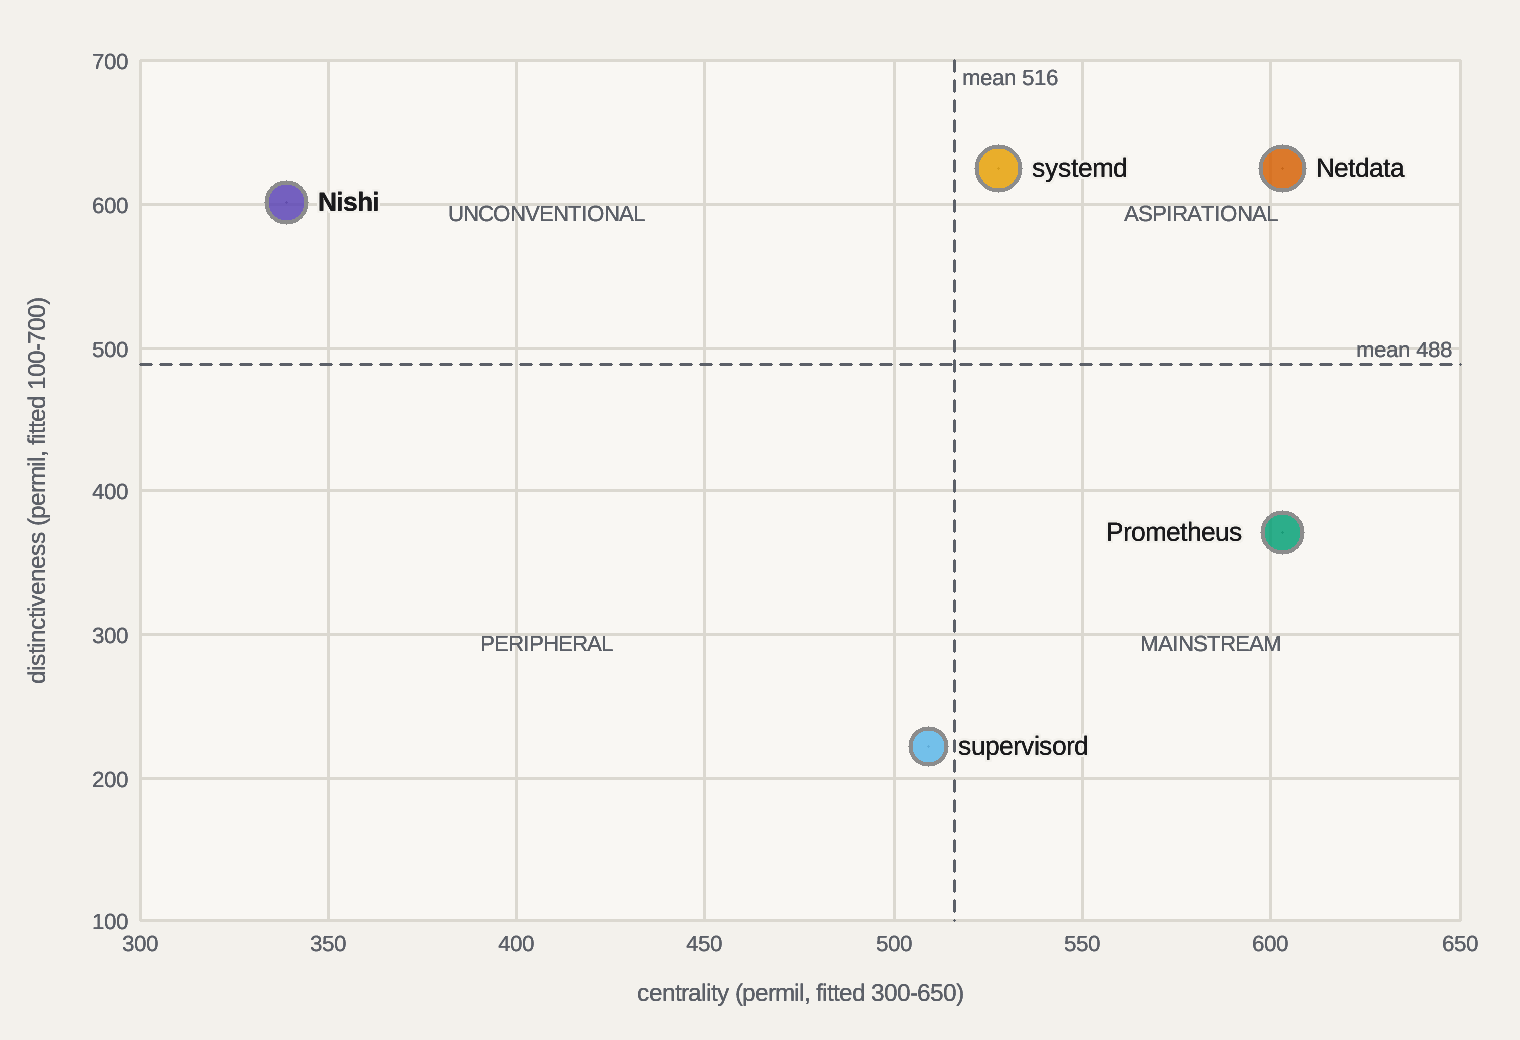
The four-quadrant map the field uses for brand strategy (Dawar and Bagga, HBR June 2015), re-derived from this matrix on every publish. Centrality is the share of the category's feature mass a player covers, each feature weighted by how many hold it; distinctiveness is the average lead over each rival on the rows the player holds; breadth is the depth-weighted share of the whole matrix (the bubble); depth is how deeply the rows held are held; momentum is the day-over-day move off the spine (green rising, red falling, grey until day two); the dashed path runs first day → previous day → today. Dividers are the category means. Axes are fitted to the field of play, so read the tick numerals, not the frame. Rival marks are documented presence, so a rival's position reads the record, never its quality. The picture grades its own readability below; the table beside it is the same data for a screen reader or a second method.
knowledge/compare/supervisor.cdmap (cut|x|y, cube|x|y|z); absent = the HBR defaultsbubble area = breadth · ring = momentum (green rising, red falling, grey until day two) · dashed = category means · axes fitted to the field of play: centrality 300–650, distinctiveness 100–700 of 0–1000 permil (the full range put every player in one corner)
readability of the 2D cut, self-graded by the layout ruler: label overlaps 0 · labels over marks 0 · off-canvas 0 · unresolved labels 0 · mark overlaps 0 (a fact of the data: two players that close are that close) · data spread 713 permil of the plot · quadrant words unseated 0
text contrast, measured with wcag2-ratio (floors from contrast.conf), light theme: labels 16.24 (floor 4.50) · notes 16.24 (floor 4.50) · quadrant words 5.89 (floor 4.50) · tick numerals 5.89 (floor 4.50) · axis titles 5.59 (floor 4.50) · dark theme: labels 13.78 (floor 4.50) · quadrant words 5.55 (floor 4.50) · axis titles 5.97 (floor 4.50) · dark classes under their floor 0 (one figure serves both themes: a dark shortfall is a token to fix, never a class to hide) · classes refused under their floor 0 (a refused class is not drawn; the scale classes are measured, never hidden) · export: SVG PNG (receipt, rendered by the estate's own rasteriser from this page)

readability of the 3D cube, self-graded by the layout ruler: label overlaps 0 · labels over marks 0 · off-canvas 0 · unresolved labels 0 · mark overlaps 1 (a fact of the data: two players that close are that close) · data spread 341 permil of the plot
10 panels over 5 registered axes, every pair once (the lower axis on x, the higher on y) · each panel fitted to its own field of play, first and last tick numerals shown · no labels in a small cut, the legend names the colours; the grade below reports the mark terms only (MM summed over the panels, spread averaged)
readability of the small multiples, self-graded by the layout ruler: label overlaps 0 · labels over marks 0 · off-canvas 0 · unresolved labels 0 · mark overlaps 7 (a fact of the data: two players that close are that close) · data spread 544 permil of the plot
| Player | Quadrant | centrality | distinctiveness | breadth | depth | momentum | Rows held | Days on spine | First seen |
|---|---|---|---|---|---|---|---|---|---|
| Nishi | Unconventional | 339 | 601 | 266 | 740 | 0 since 2026-09-23 | 9 | 10 | 2026-09-15 |
| systemd | Aspirational | 528 | 625 | 333 | 833 | 0 since 2026-09-23 | 10 | 10 | 2026-09-15 |
| supervisord | Peripheral | 509 | 222 | 160 | 444 | 0 since 2026-09-23 | 9 | 10 | 2026-09-15 |
| Prometheus | Mainstream | 603 | 371 | 266 | 512 | 0 since 2026-09-23 | 13 | 10 | 2026-09-15 |
| Netdata | Aspirational | 603 | 625 | 386 | 805 | 0 since 2026-09-23 | 12 | 10 | 2026-09-15 |
| Day | Matrix rows reviewed | Players recorded |
|---|---|---|
| 2026-09-15 | 25 | 5 |
| 2026-09-16 | 25 | 5 |
| 2026-09-17 | 25 | 5 |
| 2026-09-18 | 25 | 5 |
| 2026-09-19 | 25 | 5 |
| 2026-09-20 | 25 | 5 |
| 2026-09-21 | 25 | 5 |
| 2026-09-22 | 25 | 5 |
| 2026-09-23 | 25 | 5 |
| 2026-10-08 | 25 | 5 |
players 5|matrix rows 25|feature mass 53|centrality mean 516|distinctiveness mean 488|axes 5|spine days 10 (shown 10)|rows written today 0|readability defects 2D 0 cube 0|spine knowledge/status/cdmap/supervisor.spine
Capability matrix — measured against source
◉ authored stronger claim; source present● present◐ partial○ absent? unassessed; excluded from relative comparison · click any capability for its evidence
Peer cell coverage: authored assessed 100, unassessed 0. Authored assessments are not verified outcomes.
No capabilities match this filter or search.
| Capability | Nishi | systemd | supervisord | Prometheus | Netdata |
|---|---|---|---|---|---|
Process supervision with crash-restart guardsMeasured:hc_guard_one exists in runtime/_hdl_build/nx_hostctl.nx, verified at emit. LIVE on the NAS: supervise + per-service guards; a guard restart of nx_relate_daemon was captured in this session's nx_status output; systemd is the init-system bar [systemd-service] Adoption: PRODUCER-ALIAS — fully adopted (top of its ladder).Pros Implementing source symbol found; runtime acceptance separate; ahead of Prometheus, Netdata; fully adopted on the estate ladderCons behind systemd (leads) | ● | ◉ | ● | ○ | ○ |
Never-brick deploy watchdog (health-gated promote + auto-rollback)Measured:func ma_do_deploy exists in runtime/_hdl_build/nx_mgmt_api.nx, verified at emit. DEPLOYED-GREEN proven across mgmt/edge/office arcs; the field bars supervise OR observe -- none promote with rollback (that is Argo-class territory, see /compare/deploy) Adoption: LIVE-DAEMON — fully adopted (top of its ladder).Pros Implementing source symbol found; runtime acceptance separate; ahead of systemd, supervisord, Prometheus, Netdata; fully adopted on the estate ladderCons none on the measured axes (rival marks are documented presence, not depth) | ● | ○ | ○ | ○ | ○ |
Health snapshot + service inventory APIMeasured:ss_cat exists in runtime/_hdl_build/nx_mgmt_snapshot.nx, verified at emit. mgmt_snap.json written each poll; GET /api/services returned the live 14-service inventory over MCP in this session [supervisord] Adoption: LIB-WIRED importers=2 nonval=1 — fully adopted (top of its ladder).Pros Implementing source symbol found; runtime acceptance separate; ahead of Prometheus; fully adopted on the estate ladderCons none on the measured axes (rival marks are documented presence, not depth) | ● | ● | ● | ◐ | ● |
Deployed-capability liveness audit (BUILT is not LIVE)Measured:audit_row exists in runtime/_hdl_build/nx_reader_liveness.nx, verified at emit. The RACI monitor activity exists because a built reader shipped dead; this organ proves served-and-wired, not just compiled; Prometheus blackbox probing is the partial peer rival marks uncited — the Yes, Best or Part codes on this row are an observation read with no reference mark behind them Adoption: SOURCE-ONLY — PARTIAL: source exists, never compiled: /api/build it.Pros Implementing source symbol found; runtime acceptance separate; ahead of systemd, supervisord, Prometheus, NetdataCons not adopted yet: source exists, never compiled: /api/build it | ● | ○ | ○ | ◐ | ○ |
Accountability-routed monitoring (RACI lineage)Measured:lr_resolve exists in runtime/_hdl_build/nx_lineage_raci.nx, verified at emit. Monitoring findings resolve to the ONE accountable role; the field routes to dashboards, not owners Adoption: BUILT-UNPROMOTED — PARTIAL: compiled, never promoted to the serving root: /api/promote it.Pros Implementing source symbol found; runtime acceptance separate; ahead of systemd, supervisord, Prometheus, NetdataCons not adopted yet: compiled, never promoted to the serving root: /api/promote it | ● | ○ | ○ | ○ | ○ |
Live-derived maturity grading (anti-staleness by design)Measured:em_domain_level exists in runtime/_hdl_build/nx_ecomat_lib.nx, verified at emit. Grades re-derive from evidence files on every read -- a snapshot grade is impossible by construction; exposed live as an MCP tool Adoption: LIB-WIRED importers=22 nonval=14 — fully adopted (top of its ladder).Pros Implementing source symbol found; runtime acceptance separate; ahead of systemd, supervisord, Prometheus, Netdata; fully adopted on the estate ladderCons none on the measured axes (rival marks are documented presence, not depth) | ● | ○ | ○ | ○ | ○ |
Web health dashboardOpen — watchingruntime/nx_health_ui.nx : hu_page, re-measured on every compare beat. Ship that symbol and this mark flips itself; the comparewatch- plane row flips with it. A /health fleet UI exists in the containers arc but no serving symbol verified in THIS fleet's organs -- counted absent honestly; Netdata auto-dashboards are the bar; Prometheus needs Grafana rival marks uncited — the Yes, Best or Part codes on this row are an observation read with no reference mark behind themPros none measured yetCons behind supervisord, Prometheus, Netdata (leads); open contract; expected source declaration not established | ○ | ○ | ◐ | ◐ | ◉ |
Time-series metrics databaseOpen — watchingruntime/nx_tsdb.nx : ts_append, re-measured on every compare beat. Ship that symbol and this mark flips itself; the comparewatch- plane row flips with it. Prometheus TSDB is the bar [prometheus-overview]; our snapshots are point-in-time, no historyPros none measured yetCons behind Prometheus (leads), Netdata; open contract; expected source declaration not established | ○ | ○ | ○ | ◉ | ● |
Alerting rules + notification routingDARK —runtime/_hdl_build/nx_notice.nx EXISTS but does not declare nl_route_alert: something shipped at this path under another name, and this mark would read open forever. Repoint the contract to the real entry point (the plan rung AND this row) or rename the function; the flip follows on the next beat, and the comparewatch- plane row reads DARK until then. Alertmanager is the bar [alertmanager]; our vizsla reminder engine fires medical deadlines but is NOT wired to service alerts -- the named next rungPros none measured yetCons behind systemd, supervisord, Prometheus (leads), Netdata; open contract; expected source declaration not established | ○ | ◐ | ◐ | ◉ | ● |
Log aggregation + searchOpen — watchingruntime/nx_log_aggregate.nx : la_tail_index, re-measured on every compare beat. Ship that symbol and this mark flips itself; the comparewatch- plane row flips with it. journald is the bar; our logs are per-daemon /tmp tails read via status rival marks uncited — the Yes, Best or Part codes on this row are an observation read with no reference mark behind themPros none measured yetCons behind systemd (leads), supervisord, Netdata; open contract; expected source declaration not established | ○ | ◉ | ◐ | ○ | ◐ |
Per-service resource metrics (CPU mem IO)Open — watchingruntime/nx_resmetrics.nx : rmx_sample, re-measured on every compare beat. Ship that symbol and this mark flips itself; the comparewatch- plane row flips with it. Netdata per-second resource visibility is the bar [netdata-docs]; systemd cgroup accounting partialPros none measured yetCons behind systemd, Prometheus, Netdata (leads); open contract; expected source declaration not established | ○ | ◐ | ○ | ● | ◉ |
Anomaly detection / AIOpsOpen — watchingruntime/nx_aiops.nx : ao_detect, re-measured on every compare beat. Ship that symbol and this mark flips itself; the comparewatch- plane row flips with it. Netdata ships ML anomaly bits [netdata-ml]; nothing sovereign here yetPros none measured yetCons behind Prometheus, Netdata (leads); open contract; expected source declaration not established | ○ | ○ | ○ | ◐ | ◉ |
SLO / error-budget trackingDARK —runtime/_hdl_build/nx_hostctl.nx EXISTS but does not declare hc_slo_report: something shipped at this path under another name, and this mark would read open forever. Repoint the contract to the real entry point (the plan rung AND this row) or rename the function; the flip follows on the next beat, and the comparewatch- plane row reads DARK until then. Prometheus recording rules approximate it; we track gate GREEN, not error budgets [sre-slo]Pros none measured yetCons behind Prometheus; open contract; expected source declaration not established | ○ | ○ | ○ | ◐ | ○ |
Restart intensity bound with escalation (no crash loop forever)DARK —runtime/_hdl_build/nx_hostctl.nx EXISTS but does not declare hc_restart_intensity: something shipped at this path under another name, and this mark would read open forever. Repoint the contract to the real entry point (the plan rung AND this row) or rename the function; the flip follows on the next beat, and the comparewatch- plane row reads DARK until then. NEW WATCH 2026-09-02 (hub-and-spoke supervision class): a guard that respawns a crashing daemon without a bound turns a dead daemon into a fork storm competing with every healthy spoke -- the hub-side amplifier the estate measured on 2026-08-16, when a redundant supervisor revived a lock-blocked daemon into an eight-minute blackout. The archetype is OTP's supervisor: a restart intensity (maximum restarts within a period) past which the supervisor stops its children and itself and escalates to its parent instead of looping [otp-supervision]; systemd ships the same bound as StartLimitIntervalSec and StartLimitBurst (Best) [systemd-service]; supervisord has startretries (Yes); Prometheus and Netdata do not supervise (No). Contract: hc_guard_one reads a per-row intensity from daemons.reg, stops reviving past it, stamps the escalation on the status surface, and a gate proves a fixture that crashes on start is revived exactly N times and then HELD.Pros none measured yetCons behind systemd (leads), supervisord; open contract; expected source declaration not established | ○ | ◉ | ● | ○ | ○ |
Alive-but-never-listening bind grace (a live PID that never binds is restarted)Measured:rg_bind_grace_expired exists in runtime/nx_restart_guard.nx, verified at emit. ADDED 2026-09-02 FROM A 16-HOUR OUTAGE: hc_guard_admin tested only the process name, so a respawn that spun 15.9h of CPU inside its shard pre-warm with :18456 never opened read UP on every surface while /search answered 503. The guard now composes hp_socket_dead (connect-only, two refusals apart) with a PURE grace predicate in nx_restart_guard: a port that stays dead past HC_ADMIN_BIND_GRACE_POLLS (40 x the 15s supervise cadence, derived from the measured worst legitimate start) means kill and respawn under the crash-loop guard, every waiting poll announced. systemd covers this with TimeoutStartSec plus Type=notify readiness (Best); supervisord has startsecs (Part); Prometheus and Netdata do not supervise. Refereed by nx_restart_guard_gate T6-T10, GREEN on the laptop lane; the supervisor rebuild is queued behind the build governor. Other port-bearing guards in nx_hostctl still test the name alone -- the follow-on rival marks uncited — the Yes, Best or Part codes on this row are an observation read with no reference mark behind them Adoption: LIB-WIRED importers=5 nonval=4 — fully adopted (top of its ladder).Pros Implementing source symbol found; runtime acceptance separate; ahead of supervisord, Prometheus, Netdata; fully adopted on the estate ladderCons behind systemd (leads) | ● | ◉ | ◐ | ○ | ○ |
Socket / timer activationOpen — watchingruntime/nx_socket_activate.nx : sa_listen, re-measured on every compare beat. Ship that symbol and this mark flips itself; the comparewatch- plane row flips with it. systemd socket activation is the bar [systemd-socket]; our daemons are always-onPros none measured yetCons behind systemd (leads); open contract; expected source declaration not established | ○ | ◉ | ○ | ○ | ○ |
Dependency-ordered startup graphDARK —runtime/_hdl_build/nx_hostctl.nx EXISTS but does not declare hc_dep_order: something shipped at this path under another name, and this mark would read open forever. Repoint the contract to the real entry point (the plan rung AND this row) or rename the function; the flip follows on the next beat, and the comparewatch- plane row reads DARK until then. systemd unit graphs are the bar; hostctl starts a flat ordered list rival marks uncited — the Yes, Best or Part codes on this row are an observation read with no reference mark behind themPros none measured yetCons behind systemd (leads), supervisord; open contract; expected source declaration not established | ○ | ◉ | ◐ | ○ | ○ |
Resource-limit enforcementDARK —runtime/nx_resgov.nx EXISTS but does not declare rg_enforce: something shipped at this path under another name, and this mark would read open forever. Repoint the contract to the real entry point (the plan rung AND this row) or rename the function; the flip follows on the next beat, and the comparewatch- plane row reads DARK until then. systemd cgroup limits are the bar; rule 21 is awareness, not enforcement rival marks uncited — the Yes, Best or Part codes on this row are an observation read with no reference mark behind themPros none measured yetCons behind systemd (leads), supervisord; open contract; expected source declaration not established | ○ | ◉ | ◐ | ○ | ○ |
Multi-host federated monitoringOpen — watchingruntime/nx_fed_monitor.nx : fm_federate, re-measured on every compare beat. Ship that symbol and this mark flips itself; the comparewatch- plane row flips with it. Prometheus federation is the bar [prom-federation]; laptop+NAS+workers exist but each is watched alonePros none measured yetCons behind Prometheus (leads), Netdata; open contract; expected source declaration not established | ○ | ○ | ○ | ◉ | ◐ |
U1 visual design of the monitoring surfaceOpen — watchingruntime/nx_health_ui.nx : hu_page, re-measured on every compare beat. Ship that symbol and this mark flips itself; the comparewatch- plane row flips with it. U-axes vs the NAMED product Netdata v2.10.3 dashboard (banked 2026-07-10); we ship no monitoring UI to grade rival marks uncited — the Yes, Best or Part codes on this row are an observation read with no reference mark behind themPros none measured yetCons behind Prometheus, Netdata (leads); open contract; expected source declaration not established | ○ | ○ | ○ | ◐ | ◉ |
U2 interaction quality (drill-down, filtering, latency)Open — watchingruntime/nx_health_ui.nx : hu_page, re-measured on every compare beat. Ship that symbol and this mark flips itself; the comparewatch- plane row flips with it. Netdata per-second interactive charts are the bar; nothing of ours to grade rival marks uncited — the Yes, Best or Part codes on this row are an observation read with no reference mark behind themPros none measured yetCons behind Prometheus, Netdata (leads); open contract; expected source declaration not established | ○ | ○ | ○ | ◐ | ◉ |
U3 information design (what to look at first)Open — watchingruntime/nx_health_ui.nx : hu_page, re-measured on every compare beat. Ship that symbol and this mark flips itself; the comparewatch- plane row flips with it. Netdata auto-organizes by host and service; our status output is a raw console dump rival marks uncited — the Yes, Best or Part codes on this row are an observation read with no reference mark behind themPros none measured yetCons behind Prometheus, Netdata (leads); open contract; expected source declaration not established | ○ | ○ | ○ | ◐ | ◉ |
U4 polish and cohesionOpen — watchingruntime/nx_health_ui.nx : hu_page, re-measured on every compare beat. Ship that symbol and this mark flips itself; the comparewatch- plane row flips with it. Honest zero until a sovereign monitoring surface exists rival marks uncited — the Yes, Best or Part codes on this row are an observation read with no reference mark behind themPros none measured yetCons behind Prometheus, Netdata (leads); open contract; expected source declaration not established | ○ | ○ | ○ | ◐ | ◉ |
Promotion and monitoring as ONE never-brick circuitSource present; authored stronger claim:ma_do_deploy_status in runtime/_hdl_build/nx_mgmt_api.nx, verified at emit. Deploy gates on health, watchdog auto-rolls-back, guards respawn, liveness audits -- one auditable loop in one substrate; the field splits this across four tools and none rolls back Adoption: LIVE-DAEMON — fully adopted (top of its ladder).Pros Source symbol found; stronger capability claim is authored; ahead of systemd, supervisord, Prometheus, Netdata; fully adopted on the estate ladderCons none on the measured axes (rival marks are documented presence, not depth) | ◉ | ○ | ○ | ○ | ○ |
Capability-token remote ops with fixed-arg pinningSource present; authored stronger claim:tea_run_argv_from in runtime/nx_tool_exec_allow.nx, verified at emit. Remote status/health run pinned allowlisted subs -- a hostile argv is IGNORED (proven 2026-07-08); no ambient authority anywhere; the field uses SSH keys and bearer tokens with full shell reach Adoption: LIB-WIRED importers=41 nonval=36 — fully adopted (top of its ladder).Pros Source symbol found; stronger capability claim is authored; ahead of systemd, supervisord, Prometheus, Netdata; fully adopted on the estate ladderCons none on the measured axes (rival marks are documented presence, not depth) | ◉ | ○ | ○ | ○ | ○ |
| Class | Count | Note |
|---|---|---|
| rows with rival marks | 20 | rows carrying a Yes, Best or Part in a rival column |
| cited | 10 | a reference mark resolves to a pinned mirror |
| uncited | 10 | an observation read, badged until a reference lands |
| rows, summed | 20 | RECONCILED: the parts sum to the total 20 |
Delivery and evidence
Inspect risks, technical debt, rendered observations, experiments and references. Read scope and limitations alongside every result.
Release history and work log
| When | Rung | Kind | Entry |
|---|---|---|---|
| 2026-09-02 | R11 | land | rg_bind_grace_expired(alive, socket_dead, dead_polls, grace_polls) landed in nx_restart_guard.nx (6123 B) with nx_restart_guard_gate T6-T10 (5113 B) GREEN on the laptop lane; nx_hostctl hc_guard_admin now composes hp_socket_dead(HC_MAGIC_18456) with the predicate under HC_ADMIN_BIND_GRACE_POLLS=40 and proc_kill_by_name plus hc_spawn_admin under the crash-loop guard, every waiting poll announced; hostctl compile-proven locally (250848 B); NAS build queued as BQ-nx_hostctl under admission (procs_running 14 of 8, procs_blocked 7); deploy owed through /api/deploy target=hostctl (selfswap, superrollback) and the live HUNG-AT-START witness is the remaining done-rule conjunct |
| 2026-09-02 | R11 | lesson | the same guard predicate that fed the supervisor fed the mgmt snapshot, so a daemon that never opened its port read UP everywhere; a liveness check must include the thing the daemon exists to do (accept a connection), and the grace it needs is derived from the measured worst legitimate start, never picked |
| 2026-09-02 | R11 | land | nx_hostctl NAS-built on the first headroom of the day (252122 B sha 08b071a9, BQ row fired rc=0), staged by verified copy from buildroot/_build and DEPLOYED through the selfswap row with the audited evidence-honesty override: DEPLOYED-GREEN listen=VERIFIED; the supervisor now carries rg_bind_grace_expired in hc_guard_admin and hc_build_debug_armed in cmd_buildrun; the live HUNG-AT-START witness (a planted never-binding admin daemon restarted inside the grace bound) is the remaining done-rule conjunct |
Person · product · place — not yet measured for this domain
knowledge/compare/supervisor.ppp (rows surface|nishi or c1..c4|label|url|connect naming OUR live surface and each rival's front door), run nx_ppp_probe domain supervisor, and this section fills itself on the next beat: the same ruler on both sides — privacy and CX (third-party hosts, tracker classes, cookies, security headers), design and longevity (design hygiene, computed WCAG contrast, render-blocking resources, unsized media, script weight, theme and motion queries), findability (landmarks, skip link, on-site search, breadcrumb, headings, internal links).The field — discovered, not chosen
Rows written by nx_field_discover from supervisor.seeds: the industry's own lists (Wikipedia wikitext, GitHub topics, awesome lists) read mechanically, every candidate counted across seeds. The matrix columns above are a SEAT'S pick; this band is the population they were picked from, and the stats line measures one against the other. A rival here is a lead, never a verdict — it earns a column when its capabilities are read and pinned.
| Class | Count | Note |
|---|---|---|
| seeds | 4 | |
| scanned | 4 | |
| fetched | 4 | |
| reused | 0 | |
| failed | 0 | |
| named | 4 | |
| candidates | 4 | |
| mentions | 4 | |
| capped | 0 |
| Rank | Rival | Seeds | Mentions | First seed | Kind | Link |
|---|---|---|---|---|---|---|
| 1 | systemd | 1 | 1 | col0-systemd | named | https://man7.org/linux/man-pages/man5/systemd.service.5.html |
| 2 | supervisord | 1 | 1 | col1-supervisord | named | https://supervisord.org/ |
| 3 | Prometheus | 1 | 1 | col2-prometheus | named | https://prometheus.io/docs/introduction/overview/ |
| 4 | Netdata | 1 | 1 | col3-netdata | named | https://learn.netdata.cloud/docs/welcome-to-netdata |
field candidates 4|shown 4 of 4|matrix columns in the field 4 of 4|discovered rivals with no column 0|malformed rows 0 (counted, never rendered)|read-capped 0
Exclusive and shared capabilities
This board grades 21 capabilities: 19 exclusive to it and 2 shared with other boards. Shared rows on this page: 2 = home here 0 + home elsewhere 0 + ambiguous 0 + undecided 2 + refused 0 (partition 2); undecided = unmapped 0 + unproven 2 + unevidenced 0; homonyms 0; since the previous census: new 0, resolved 0. Census FRESH age_s=6369.
| Capability | Organ | Boards grading it | Home | Rule | Evidence | Standing on this board |
|---|---|---|---|---|---|---|
| ma_do_deploy_status | nx_mgmt_api.nx | deploy, supervisor | — | none | unproven | undecided |
| em_domain_level | nx_ecomat_lib.nx | supervisor, referee, ecosystem | — | none | unproven | undecided |
Gaps from the record — what the estate does that no board carries
The record census (nx_goalmap record) reads the invoked-tool population and every plan queue row and files each organ or directive that NO matrix, plan or gates row names. A row here is a callout the boards missed: adjudicate it onto a board or declare it infrastructure. Census state STALE (age 1395474 s), sources read 4 of 7 declared — a BLIND census is a FLOOR: unread sources can only add rows.
| kind | name | board | source | evidence |
|---|
rows shown 0|this board's directives 0|estate-wide un-boarded organs 452 (listed in full on /compare/ecosystem)|census rows 639|malformed 0 (counted, never rendered)
References
- [systemd-service] systemd project. systemd.service(5) -- Service unit configuration: Restart=, RestartSec, StartLimitBurst and the ExecStart/Type lifecycle (man page as mirrored by man7.org). publisher · read in our library
knowledge/fetched/cmp_supervisor_systemd-service5.html· pinh6739e3cd7dd45b902c5fd07d4361f74578b947791f872700ed8bb084571032dd· accessed 2026-08-18 · vendor-docGrounds: The Process supervision with crash-restart guards row where systemd is the init-system bar (Best): Restart= plus start-rate limiting is the documented mechanism hostctl supervise (PID + SERVING probe + crash-loop backoff) is graded against, and the Dependency-ordered startup graph and Resource-limit enforcement rows that name systemd unit graphs and cgroup limits as the bar. - [systemd-socket] systemd project. systemd.socket(5) -- Socket unit configuration: socket-based activation, ListenStream and Accept= (man page as mirrored by man7.org). publisher · read in our library
knowledge/fetched/cmp_supervisor_systemd-socket5.html· pinh2a5afec02e7666f911244e888dd1700b45e0d2c36259054b9292b144e21bff1f· accessed 2026-08-18 · vendor-docGrounds: The Socket / timer activation row (_ABSENT_ nx_socket_activate): systemd socket activation is the bar; our daemons are always-on, which is what this row honestly marks 0. - [supervisord] Supervisor project. Supervisor: A Process Control System (supervisord.org) -- supervisord daemon, supervisorctl, program autorestart and startretries, XML-RPC interface and web UI. publisher · read in our library
knowledge/fetched/cmp_supervisor_supervisord.html· pinh6521253bca91b8b99bc52f670351da5bf3d04632ff574fcfa09e847275593dcf· accessed 2026-08-18 · vendor-docGrounds: The supervisord column: Process supervision with crash-restart guards (Yes), Health snapshot + service inventory API (supervisorctl status), Web health dashboard (Part) and Alerting rules + notification routing (Part via event listeners) -- the classic userland process controller the Nishi supervise loop is peer to. - [prometheus-overview] Prometheus Authors. Prometheus Overview (prometheus.io/docs/introduction/overview): multi-dimensional time-series data model, PromQL, pull-based scraping, local TSDB and Alertmanager integration. publisher · read in our library
knowledge/fetched/cmp_supervisor_prometheus.html· pinh67aef8e1953b5999ee3e69eacc8d956caa0a233b19f117b29f1ee3081fbedea0· accessed 2026-08-18 · vendor-docGrounds: The Prometheus column: Time-series metrics database (Prometheus TSDB is the bar for the _ABSENT_ nx_tsdb row), SLO / error-budget tracking (recording rules approximate it), Deployed-capability liveness audit (blackbox probing is the partial peer) and Web health dashboard (needs Grafana). - [alertmanager] Prometheus Authors. Alerting Overview -- Alertmanager (prometheus.io/docs/alerting/latest/overview): alerting rules in Prometheus, grouping, inhibition, silencing and notification routing to receivers. publisher · read in our library
knowledge/fetched/cmp_supervisor_alertmanager.html· pinhdc5e41383bee1d16eba4d4366a7240a9305cb949608c4c3f72d6a48f16ce3065· accessed 2026-08-18 · vendor-docGrounds: The Alerting rules + notification routing row (_ABSENT_ nx_alerting): Alertmanager is the bar; the vizsla reminder engine fires medical deadlines but is NOT wired to service alerts -- the named next rung. - [prom-federation] Prometheus Authors. Federation (prometheus.io/docs/prometheus/latest/federation): hierarchical and cross-service federation of time series between Prometheus servers. publisher · read in our library
knowledge/fetched/cmp_supervisor_prom-federation.html· pinhf5c25a4f97a6717b323866e71fc999dccb1c62d33d699def2bbd0e62d76a8a94· accessed 2026-08-18 · vendor-docGrounds: The Multi-host federated monitoring row (_ABSENT_ nx_fed_monitor): Prometheus federation is the bar; laptop + NAS + workers exist but each is watched alone. - [netdata-docs] Netdata Inc. Welcome to Netdata (learn.netdata.cloud): per-second real-time metrics collection, auto-generated dashboards, agent-parent streaming and Netdata Cloud. publisher · read in our library
knowledge/fetched/cmp_supervisor_netdata.html· pinh269df330a39c45855862bbbaf70bcc4cecf683c63f85759542d56cced5890885· accessed 2026-08-18 · vendor-docGrounds: The Netdata column: Per-service resource metrics (per-second visibility is the bar), Web health dashboard (auto-dashboards are the bar) and the U1-U4 UI/PRODUCT axes graded against the NAMED Netdata v2.10.3 dashboard -- U1 visual design, U2 interaction quality, U3 information design, U4 polish and cohesion. - [netdata-ml] Netdata Inc. Machine Learning Anomaly Detection (learn.netdata.cloud/docs/netdata-ai/anomaly-detection): unsupervised k-means models trained per metric on the agent, anomaly bit per sample, Anomaly Advisor. publisher · read in our library
knowledge/fetched/cmp_supervisor_netdata-ml.html· pinh3b1a5c33fcf67079acf25b361f0a900b995f5ece3e3d49f12cb0fc578415a1a2· accessed 2026-08-18 · vendor-docGrounds: The Anomaly detection / AIOps row (_ABSENT_ nx_aiops): Netdata ships ML anomaly bits; nothing sovereign here yet. - [sre-slo] Beyer, Jones, Petoff, Murphy (eds). Site Reliability Engineering: How Google Runs Production Systems, chapter 4 Service Level Objectives (sre.google/sre-book). O'Reilly, 2016. publisher · read in our library
knowledge/fetched/cmp_supervisor_sre-slo.html· pinh449fb54ce65e05102fac46c797a08b86c5ab93ade2c70c63ae25e7648d687d7d· accessed 2026-08-18 · published-courseGrounds: The SLO / error-budget tracking row (_ABSENT_ nx_slo): SLI, SLO and error budget are this chapter's definitions; we track gate GREEN, not error budgets, and Prometheus recording rules only approximate it. - [otp-supervision] Ericsson AB. Erlang/OTP System Documentation, OTP Design Principles: Supervisor Behaviour -- supervision trees, restart strategies (one_for_one, one_for_all, rest_for_one) and the restart intensity bound (maximum restarts within a period) past which a supervisor stops its children and itself instead of crash-looping. publisher · read in our library
knowledge/fetched/cmp_supervisor_otp-supervision.html· pinh3d990d5bf67a0e4fbb5e2af86b7e74f6b1ae5db8a27d8f49a3a8648e980be8df· accessed 2026-09-02 · vendor-docGrounds: The Restart intensity bound with escalation row (_ABSENT_ hc_restart_intensity): the supervision-tree archetype our hostctl guard is the young twin of, and the bound it lacks -- OTP names the restart intensity and the escalation, systemd ships them as StartLimitIntervalSec and StartLimitBurst.
generated by nx_swcompare_matrix (sovereign NishiLang organ) from knowledge/compare/supervisor.matrix · source checks show implementation presence; runtime and user-outcome evidence are reported separately · JavaScript supports page controls